Average House Price in Belgium - Complete Regional Price Analysis

The Short Answer
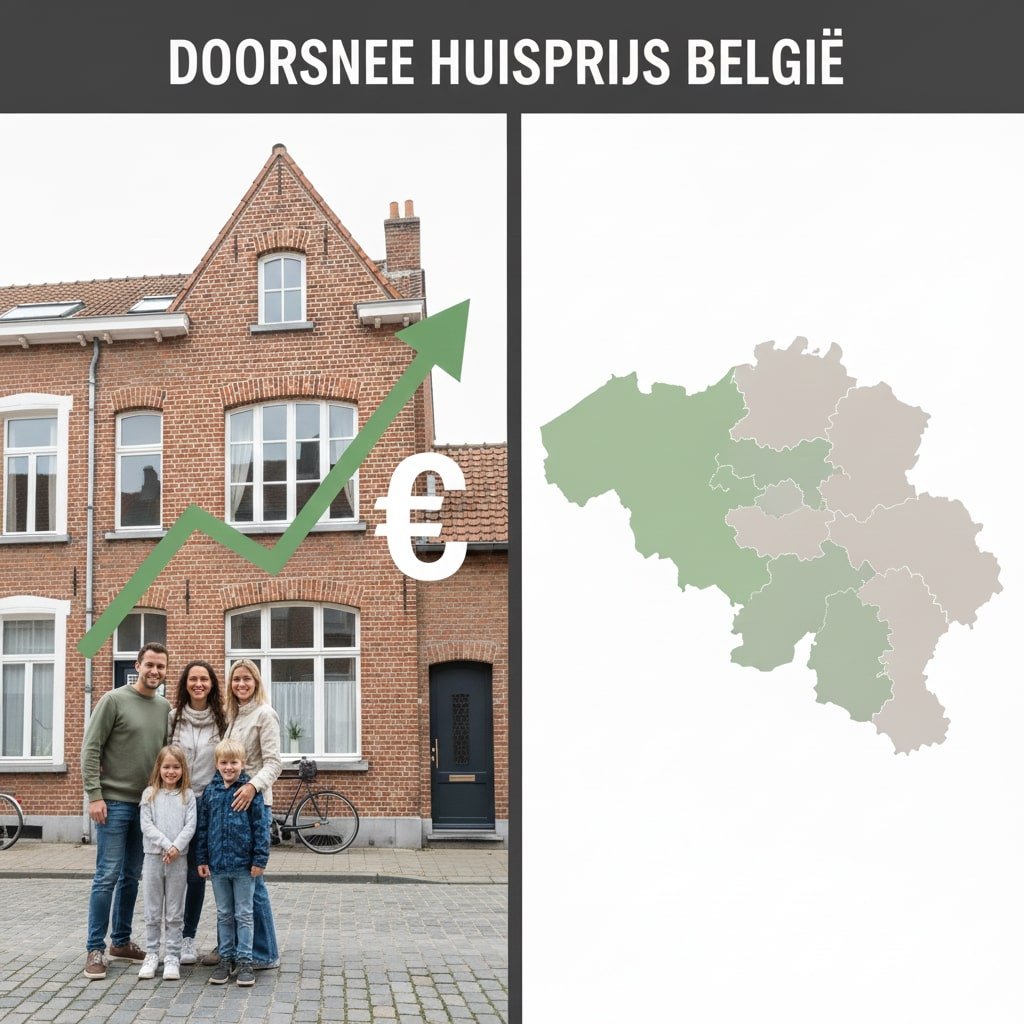
BELGIAN HOUSE PRICES 2025 - National Snapshot:
The Key Figures (December 2025):
| Metric | Price | Details |
|---|---|---|
| National Median Price | €285,000 | Mid-Market |
| National Average Price | €310,000 | Average across All of Belgium |
| Most Expensive Region | Brussels/Antwerp | €380,000+ on Average |
| Most Affordable Region | Wallonia (Liège) | €210,000-€240,000 |
| Price per m² | €3,500-€5,500 | Depending on Region |
| Annual Growth | +3.6% (2025) | Recovery after High-Rate Period |
This Article Gives You a COMPLETE Overview!
1. National Median House Prices - The Baseline
Average VS Median Price (IMPORTANT!)
MEDIAN PRICE = The Middle of the Market:
✦ 100% free & No obligation
Sell your property with the best agent
Compare the top 3 agents in your region for free and save on commission.
Compare agents →- 50% of Homes are CHEAPER
- 50% of Homes are MORE EXPENSIVE
- Better Picture of the "Typical" Property!
- Belgium: €285,000 (Median)
AVERAGE PRICE = Total Divided by Number of Sales:
- Very EXPENSIVE Homes Pull this Figure UP
- Less Representative
- Belgium: €310,000 (Average)
WHY THE MEDIAN MATTERS: Far Better for Budget Planning!
Market Trends 2024-2025
What Has Happened:
| Period | Price Change | Context |
|---|---|---|
| 2023 | -2.5% | High Interest Rates Deter Buyers |
| Early 2024 | -1.0% | Market Continues to Slide |
| Mid-2024 | +0.8% | Rates Begin to Fall |
| Late 2024 | +2.1% | Clear Recovery |
| 2025 (Last 12 Months) | +3.6% | STRONG GROWTH! |
NOTE: Figures Can Vary by Source (Notaries VS Online Platforms)
2. Prices by Region - A Regional Breakdown
FLANDERS - The Most Expensive Region
Major Cities (Median Prices):
| City | Median Price | Per m² | Profile |
|---|---|---|---|
| Bruges | €345,000 | €4,800-€5,200 | UNESCO Premium |
| Antwerp | €380,000 | €5,000-€5,500 | Economic Hub |
| Leuven | €335,000 | €4,700-€5,000 | University City |
| Ghent | €320,000 | €4,500-€4,800 | Friendly/Trendy |
| Mechelen | €295,000 | €4,200-€4,500 | Central Location |
| Kortrijk | €280,000 | €3,800-€4,100 | Border City |
| Hasselt | €270,000 | €3,600-€3,900 | Limburg Centre |
| Aalst | €245,000 | €3,300-€3,600 | Affordable |
FLANDERS AVERAGE: €305,000
BRUSSELS-CAPITAL - The Capital Premium
Neighbourhoods (Median Prices):
| Neighbourhood | Price | Per m² | Profile |
|---|---|---|---|
| Anderlecht | €220,000 | €2,800-€3,200 | Affordable/In Transition |
| Molenbeek-Saint-Jean | €280,000 | €3,500-€4,000 | Renewal |
| Ixelles | €380,000 | €5,000-€5,500 | Chic/Bohemian |
| Woluwe-Saint-Pierre | €400,000 | €5,200-€5,800 | Premium/Green |
| Auderghem | €350,000 | €4,600-€5,100 | Well-Heeled |
| Brussels Centre | €320,000 | €4,200-€4,800 | Grand Place Area |
| Saint-Gilles | €300,000 | €4,000-€4,500 | Bohemian |
BRUSSELS AVERAGE: €320,000
WALLONIA - The Most Affordable Region
Major Cities (Median Prices):
| City | Median Price | Per m² | Profile |
|---|---|---|---|
| Liège | €210,000 | €2,400-€2,800 | MOST AFFORDABLE! |
| Namur | €240,000 | €2,800-€3,200 | Cultural |
| Charleroi | €185,000 | €2,000-€2,400 | In Transformation |
| Mons | €217,000 | €2,500-€2,900 | UNESCO |
| Bergen | €200,000 | €2,300-€2,700 | Industry→Culture |
| Ciney | €225,000 | €2,600-€3,000 | Ardennes |
| Tournai | €215,000 | €2,500-€2,900 | UNESCO |
WALLONIA AVERAGE: €215,000
Regional Comparison
At a Glance:
| Region | Average Price | Per m² | Difference vs Wallonia |
|---|---|---|---|
| Flanders | €305,000 | €4,100-€4,500 | +42% MORE EXPENSIVE |
| Brussels | €320,000 | €4,300-€4,700 | +49% MORE EXPENSIVE |
| Wallonia | €215,000 | €2,600-€3,000 | BASELINE |
WALLONIA ADVANTAGE: Significantly Better Value for Money!
FLANDERS/BRUSSELS ADVANTAGE: Stronger Economic Hub, Better Returns
3. Price per m² - The Efficiency Metric
How to Interpret It
PRICE PER m² = Property Price ÷ Floor Area in Square Metres
Example:
- Property Value: €300,000
- Size: 100 m²
- Price/m²: €3,000/m²
National Ranges by Region
FLANDERS:
- Urban (Bruges, Antwerp): €4,800-€5,500/m²
- Mid-Size Cities: €3,500-€4,200/m²
- Rural: €2,500-€3,500/m²
BRUSSELS:
- Premium Centre: €5,000-€5,800/m²
- Inner Outskirts: €3,500-€4,500/m²
- Outer Periphery: €2,800-€3,500/m²
WALLONIA:
- City Centres: €2,800-€3,500/m²
- Secondary Cities: €2,000-€2,800/m²
- Rural: €1,200-€2,000/m²
What Is a "Fair" Price/m²?
Practical Question: Is €3,500/m² a Good Price?
| Situation | Answer |
|---|---|
| Small Town in Wallonia | ❌ NO (Too Expensive!) |
| Mid-Size City in Flanders | ⚠️ FAIR (About Right) |
| Premium Neighbourhood in Brussels | ✅ YES (Good Value!) |
| Rural Wallonia | ❌ NO (2-3× Too Expensive!) |
RULE: ALWAYS Compare with the Local Market, Not the National Median!
4. Price Determinants - Why Such Differences?
Macro Factors
| Factor | Effect | Details |
|---|---|---|
| Location (City vs. Countryside) | +++++ VERY HIGH | Cities = 2-4× More Expensive |
| Economic Hub | ++++ HIGH | Brussels/Antwerp Premium |
| Public Transport | +++ MEDIUM | Closer to a Station = Higher Value |
| Schools/Education | +++ MEDIUM | Good Schools = 10-15% Premium |
| Neighbourhood Prestige | ++++ HIGH | Upmarket Areas = Higher Value |
| Green Space | ++ LOW | Parks/Forests = 5-10% Premium |
Micro Factors (Property-Specific)
| Factor | Effect | Details |
|---|---|---|
| Size | +++ MEDIUM | Larger Homes = % Cheaper per m² |
| Garden | ++ LOW | Front/Back Garden = 5-10% |
| Energy Certificate | ++ LOW | A-Rating = 5-8% Premium |
| Renovation Condition | +++++ VERY HIGH | Renovated = 20-40% More |
| Parking | ++ LOW | Garage = 5-8% Extra |
| View | ++ LOW | Water/Green View = 5-10% Extra |
5. Property Types - Price by Type
Apartment (Most Affordable)
Median Prices 2025:
| Region | Studio | 1 Bedroom | 2 Bedrooms |
|---|---|---|---|
| Wallonia | €85,000 | €120,000 | €165,000 |
| Flanders | €130,000 | €180,000 | €250,000 |
| Brussels | €150,000 | €210,000 | €290,000 |
ADVANTAGE: Affordable, Low Maintenance, Central Location
Terraced House (Most Popular)
Median Prices 2025:
| Region | Small (80-100 m²) | Medium (120-150 m²) | Large (180-200 m²) |
|---|---|---|---|
| Wallonia | €180,000 | €280,000 | €380,000 |
| Flanders | €280,000 | €380,000 | €520,000 |
| Brussels | €250,000 | €350,000 | €480,000 |
MOST POPULAR: Best Balance of Price, Space and Garden
Villa (Premium)
Median Prices 2025:
| Region | Small (250-300 m²) | Medium (350-400 m²) | Large (500+ m²) |
|---|---|---|---|
| Wallonia | €450,000 | €650,000 | €950,000+ |
| Flanders | €650,000 | €900,000 | €1,300,000+ |
| Brussels/Premium Area | €750,000 | €1,100,000 | €1,600,000+ |
ADVANTAGE: Exclusive, Large Garden, Prestige
6. Price Trends 2025 - Where Is the Market Heading?
Short Term (2025-2026)
Forecast:
- Interest Rates STABLE (No Major Drop Expected)
- Market NORMALISING after 2024-2025 Growth
- Growth SLOWING: +1.5% to +3.0% Expected
- BUYERS MARKET Persists (No Need to Overbid!)
ADVICE: This Is Still a BUYERS MARKET! Negotiation Is Possible!
Medium Term (2026-2028)
Forecast:
- Interest Rates Could FALL (ECB Possible)
- House Prices +2.0% to +4.0%/Year
- Energy Renovation Increases Value (+5-10%)
- POPULATION Growth (More Housing Demand)
ADVICE: Energy Transition = Future Value!
Risks
What Could Push Prices Down:
- ❌ Rates RISING SHARPLY (Unlikely)
- ❌ Economic RECESSION (Possible but Not Expected)
- ❌ Massive POPULATION DECLINE (Unlikely)
- ❌ Mortgage MARKET COLLAPSE (Unlikely)
VERDICT: Prices Expected to Remain STABLE with MODEST Growth!
7. Regional Opportunities - Where Can You Save?
BEST VALUE FOR MONEY (2025)
| Location | Price | Advantage | Risk |
|---|---|---|---|
| Liège (Wallonia) | €210,000 (Median) | MOST AFFORDABLE! Cultural Centre | Weaker Economy |
| Aalst (Flanders) | €245,000 | Halfway between Brussels and Ghent | Smaller City |
| Hasselt (Limburg) | €270,000 | Growing City, Affordable | Regional |
| Namur (Wallonia) | €240,000 | Attractive Centre, Good Value | Less Central |
| Kortrijk (West Flanders) | €280,000 | Border City, Growing | Out of the Way |
BEST BET: Liège or Namur (Quality + Price!)
PREMIUM LOCATIONS (For a Luxury Budget)
| Location | Price | Value Proposition | Target Buyer |
|---|---|---|---|
| Bruges (UNESCO) | €345,000 | Tourism + Investment | Investors |
| Antwerp (Hub) | €380,000 | Economically Strong | Professionals |
| Leuven (University) | €335,000 | Student Rental | Buy-to-Let Investors |
| Ixelles (Brussels) | €380,000 | Chic/Bohemian | City Lovers |
| Woluwe (Brussels) | €400,000 | Luxury/Green | Well-Heeled Buyers |
BEST BET: Antwerp (Economic Strength!)
8. Who Sets the Prices? - Data Sources
Official Sources in Belgium
| Source | Reliability | Coverage | Details |
|---|---|---|---|
| Notaries | ⭐⭐⭐⭐⭐ | Complete | All Official Transactions |
| Zaalsgroep | ⭐⭐⭐⭐ | Wide | Estate Agent Data |
| ImmoSolo/Idealista | ⭐⭐⭐ | Online | Listing Prices (Asking Prices!) |
| National Bank of Belgium | ⭐⭐⭐⭐ | Systemic | Official Statistics |
| Realtor.com/Immovlan | ⭐⭐⭐ | Online | Online Listing Data |
BEST SOURCE: Notaries (Most Official + Real Transactions!)
Why Do Prices Differ by Source?
ImmoVlan/Online (HIGHER):
- Shows "Asking Price" (What Sellers HOPE to Get)
- Not the Actual Sale Price
- Typically +5-15% Higher!
Notaries (ACCURATE):
- Shows "Actual Sale Price"
- All Official Transactions
- MOST RELIABLE!
ADVICE: Use Notary Data for a Realistic Price!
9. Checklist - How to Evaluate a Property
BEFORE You Buy
- ☐ Check the Median Price in YOUR Neighbourhood (Not Nationally!)
- ☐ Compare Price per m² with LOCAL Properties
- ☐ Check the Energy Performance Certificate (Future Value!)
- ☐ Compare the Price with 5-10 Similar Properties
- ☐ Ask Yourself: "Is This Price In Line with the Market?"
BEFORE You Sell
- ☐ Research Similar Properties in the Neighbourhood
- ☐ Ask an Agent for a Market Analysis (CMA)
- ☐ Be Realistic (Don't Overprice!)
- ☐ Monitor Comparable Sales Data
- ☐ Set a Realistic Asking Price
10. Summary: Average House Price in Belgium 2025
Key Facts:
- NATIONAL MEDIAN: €285,000 (Mid-Market)
- NATIONAL AVERAGE: €310,000 (Pulled Up by Expensive Properties)
- BY REGION:
- Wallonia (Cheapest): €215,000 Average
- Flanders (Middle): €305,000 Average
- Brussels (Most Expensive): €320,000 Average
- PER SQUARE METRE:
- Wallonia: €2,600-€3,000/m²
- Flanders: €4,100-€4,500/m²
- Brussels: €4,300-€4,700/m²
- TREND 2025: +3.6% Growth (Recovery after High-Rate Period)
- MARKET TYPE: BUYERS MARKET (Negotiation Is Possible!)
- BEST VALUE: Liège/Namur (Wallonia)
- BEST INVESTMENT: Antwerp/Leuven (Growth + Returns)
- PRICE SOURCES:
- Notaries = Most Accurate
- Online = Overestimated (Asking Prices)
- Agent CMA = Good for Local Context
- CAUTION: ALWAYS Compare with the Local Market, Not National Statistics!
Golden Rule: The Median Price Is Better than the Average! Focus on YOUR Local Market, NOT National Statistics!
Next Step
Looking to Buy or Sell in 2025?
- Define Your Budget (€215k-€380k Range)
- Choose Your Region (Wallonia/Flanders/Brussels?)
- Compare LOCAL Properties (Not Nationally!)
- Check Notary Data (Most Accurate)
- Ask an Agent for a CMA (Comparative Market Analysis)
- Negotiate! (This Is a BUYERS MARKET!)
Good luck!
Frequently asked questions
What is the average house price in Belgium in 2025?
The national median house price in Belgium is €285,000, while the average price is €310,000. The median is a better figure for budget planning, as expensive homes pull the average upward.
Which region in Belgium has the most affordable house prices?
Wallonia is the most affordable region, with an average price of €215,000. Liège has the lowest median at €210,000, making it the most affordable major city in Belgium.
What is the difference between asking price and actual sale price in Belgium?
Online platforms like ImmoVlan show asking prices, which are typically 5-15% higher than what properties actually sell for. Notary data reflects real transaction prices and is considered the most reliable source.
How much did Belgian house prices grow in 2025?
Belgian house prices grew by 3.6% over the last 12 months of 2025, following a recovery period after two years of decline in 2023 and early 2024 when high interest rates slowed the market.
Does a better energy certificate affect the value of a home in Belgium?
Yes, an A-rated energy certificate adds roughly 5-8% to a property's value. Looking ahead to 2026-2028, energy renovation is expected to increase value by 5-10% as the energy transition progresses.
"Tech entrepreneur and strategist focused on digital transformation in the real estate sector."